You can check how your website is working by analyzing its statistics.
Eyenaz website statistics will show where your traffic is coming from, how users interact with your site, and how your website performs.
If you track your site's traffic, you can discover where your site stands and what you can do to promote it.
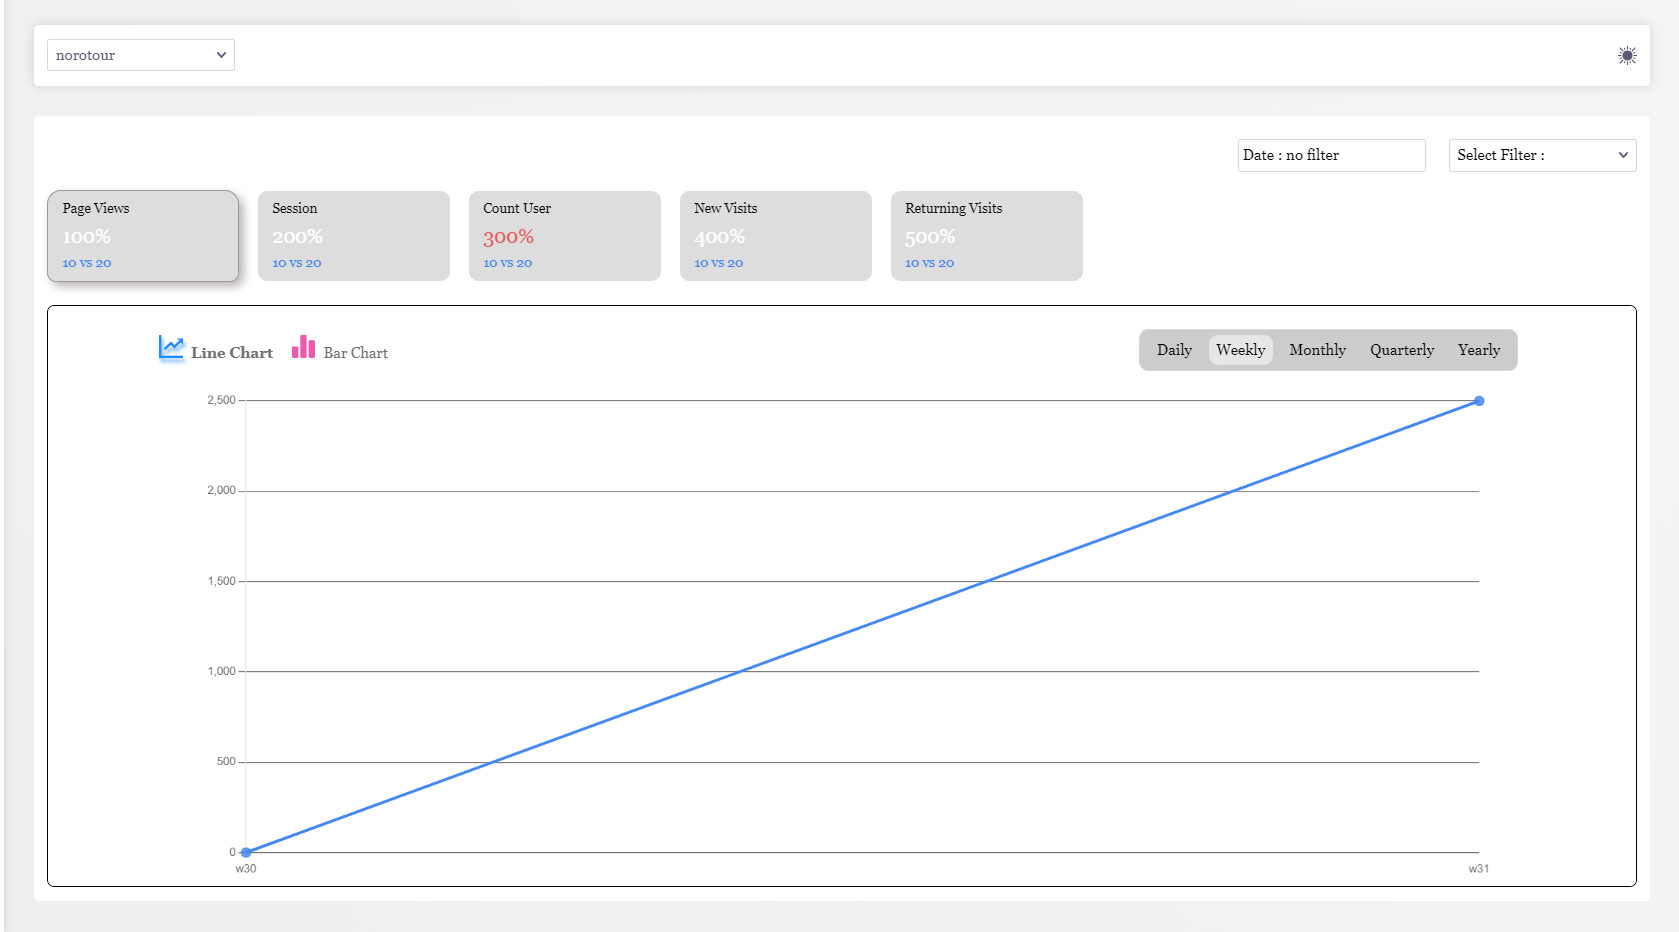
You can watch different charts to examine your website performance.
There are charts of two types: Bar charts and Line charts.
If you select the line chart, you can see the stats in line-shaped, and in the bar chart, you can see them column-shaped.
Eyenaz statistics tools provide:
• page views to show the number of views a webpage is gotten over a while.
• session views to view all interactions with your website at a specific time.
• number of users to watch the total users that have visited your web pages.
• new visits to observe how many new users have visited your website.
• returning visits to see users who visited your site once and now return to visit again.
Segmentation
Special filters that are applicable in the Statistics charts are:
Time: determine daily, weekly, monthly, quarterly, or yearly for charts.
Date: choose a specific time such as this week, last month, last year, or a custom option with your desired date.
Platform: view how users enter your site using different devices, such as desktop, mobile, and tablet.
Channel: choose different channels that visitors use for your site.
Country: visit a list of various countries from which you can select.
More elements are available in the Details section of Eyenaz statistics tools. You can apply many filters at the same time and check the statistical results.
Statistics display the daily stats of the website pages. However, if you want to see individual page stats, go to the Pages section.