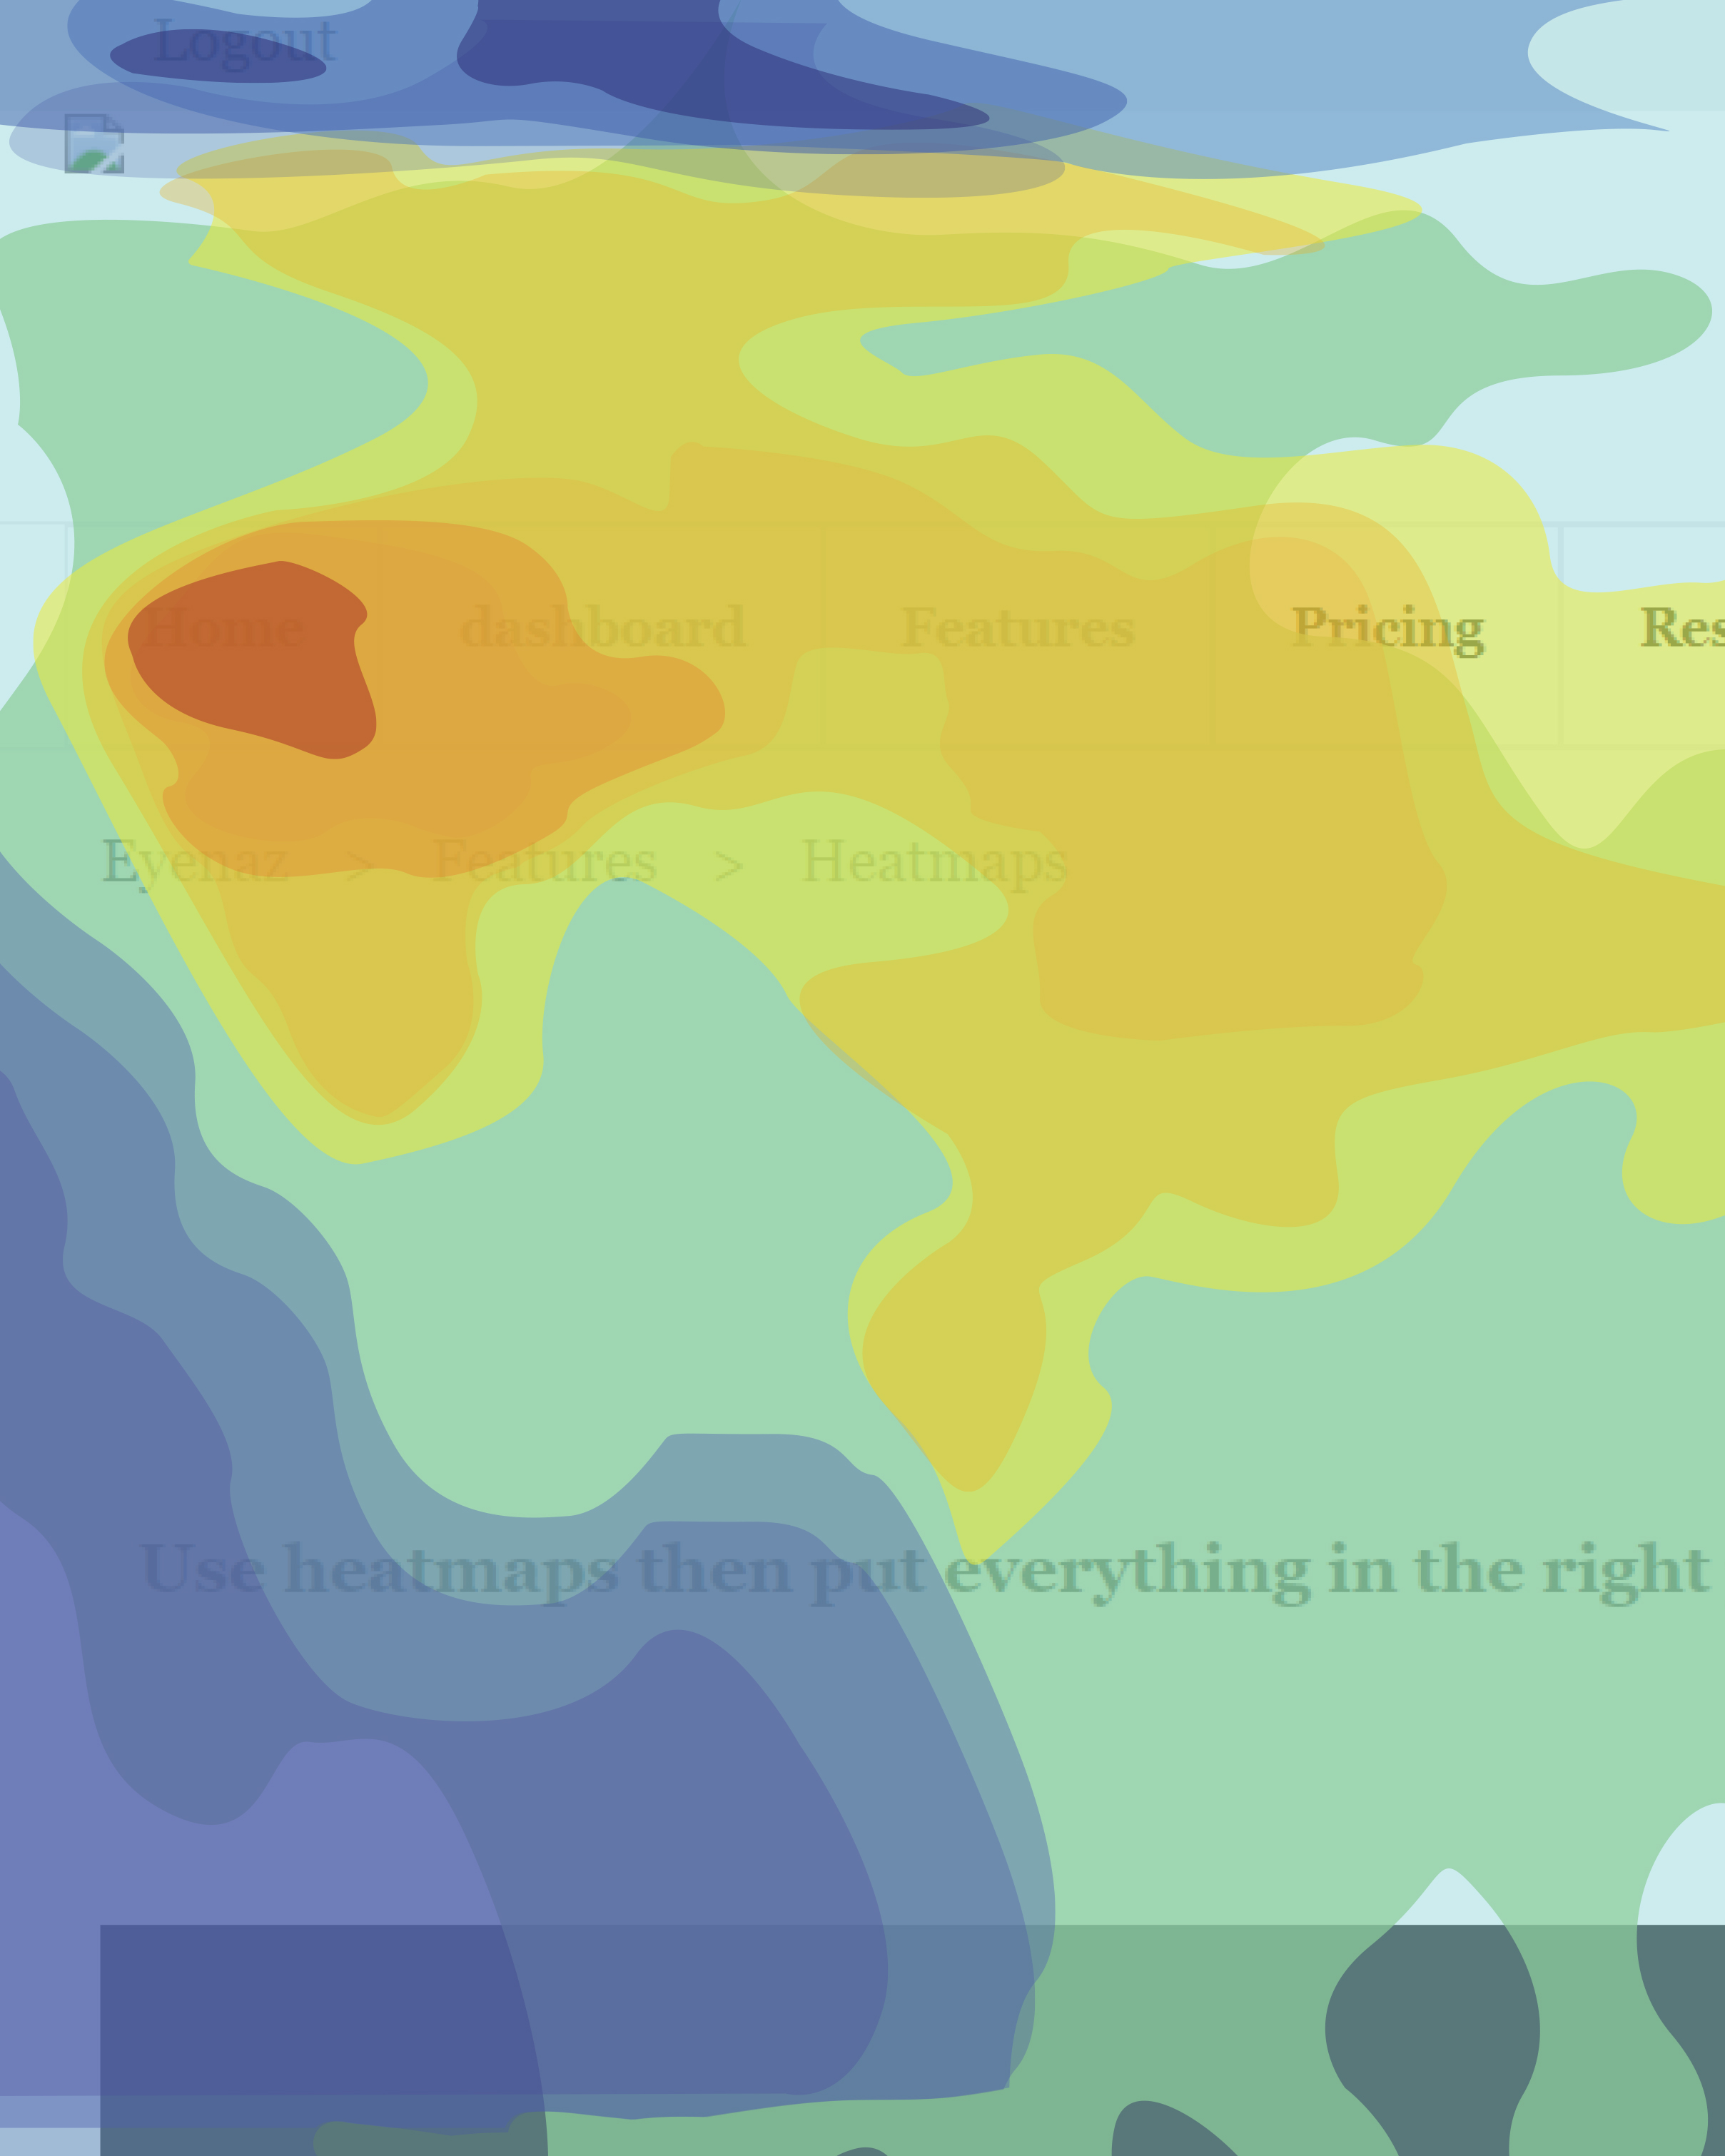
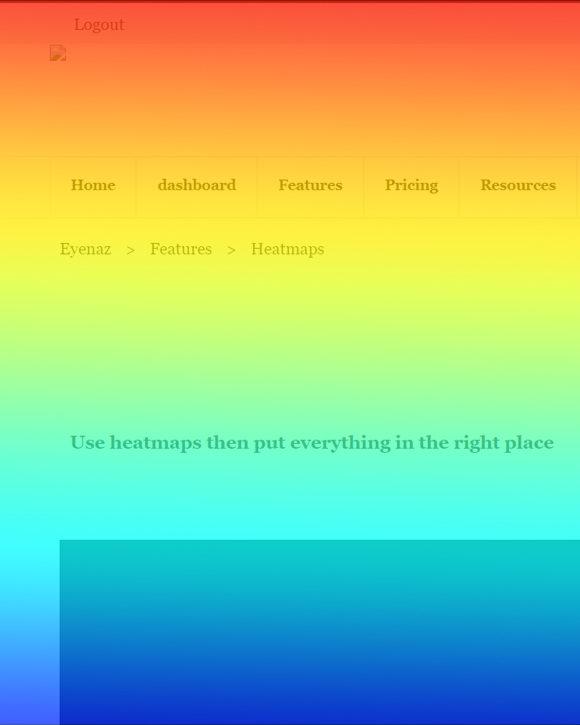
Use the heatmap tool to keep track of all actual visitors' behavior, such as clicking distribution and frequency, mouse movement, or scrolling, then start optimizing your website's UX and usability.

Looking for an accurate, easy-to-use output format from user experiences to find their preferences? You are in the right place.
The heatmap software collects the data from user activities right from the beginning to the end and visually represents all user clicks, mouse movements, and scrolls, displaying users' behavior so that you can get insight into users' interests on-the-spot.
• Identify the page elements that receive the most clicks.
• Examine how far down website visitors have scrolled.
• Monitor what elements get the most attention and what has the least friction.

What are the most significant buttons or links on your page that lead the users to their desired outcome?
Are users likely to notice and click on these links?
A click map shows how users interact with a page, which links they click the most, and which elements are causing them to be distracted as non-clickable items.
Have you noticed how many visitors may drop off your page before getting what they are looking for?
The scroll map indicates how far users navigate the page and helps you place significant elements in the most appropriate position based on how deep users scroll.
How can you find the best position to put significant CTAs on your pages?
According to the mouse movement map, you can quickly determine what areas of the site receive the most user attention and what parts are largely neglected.