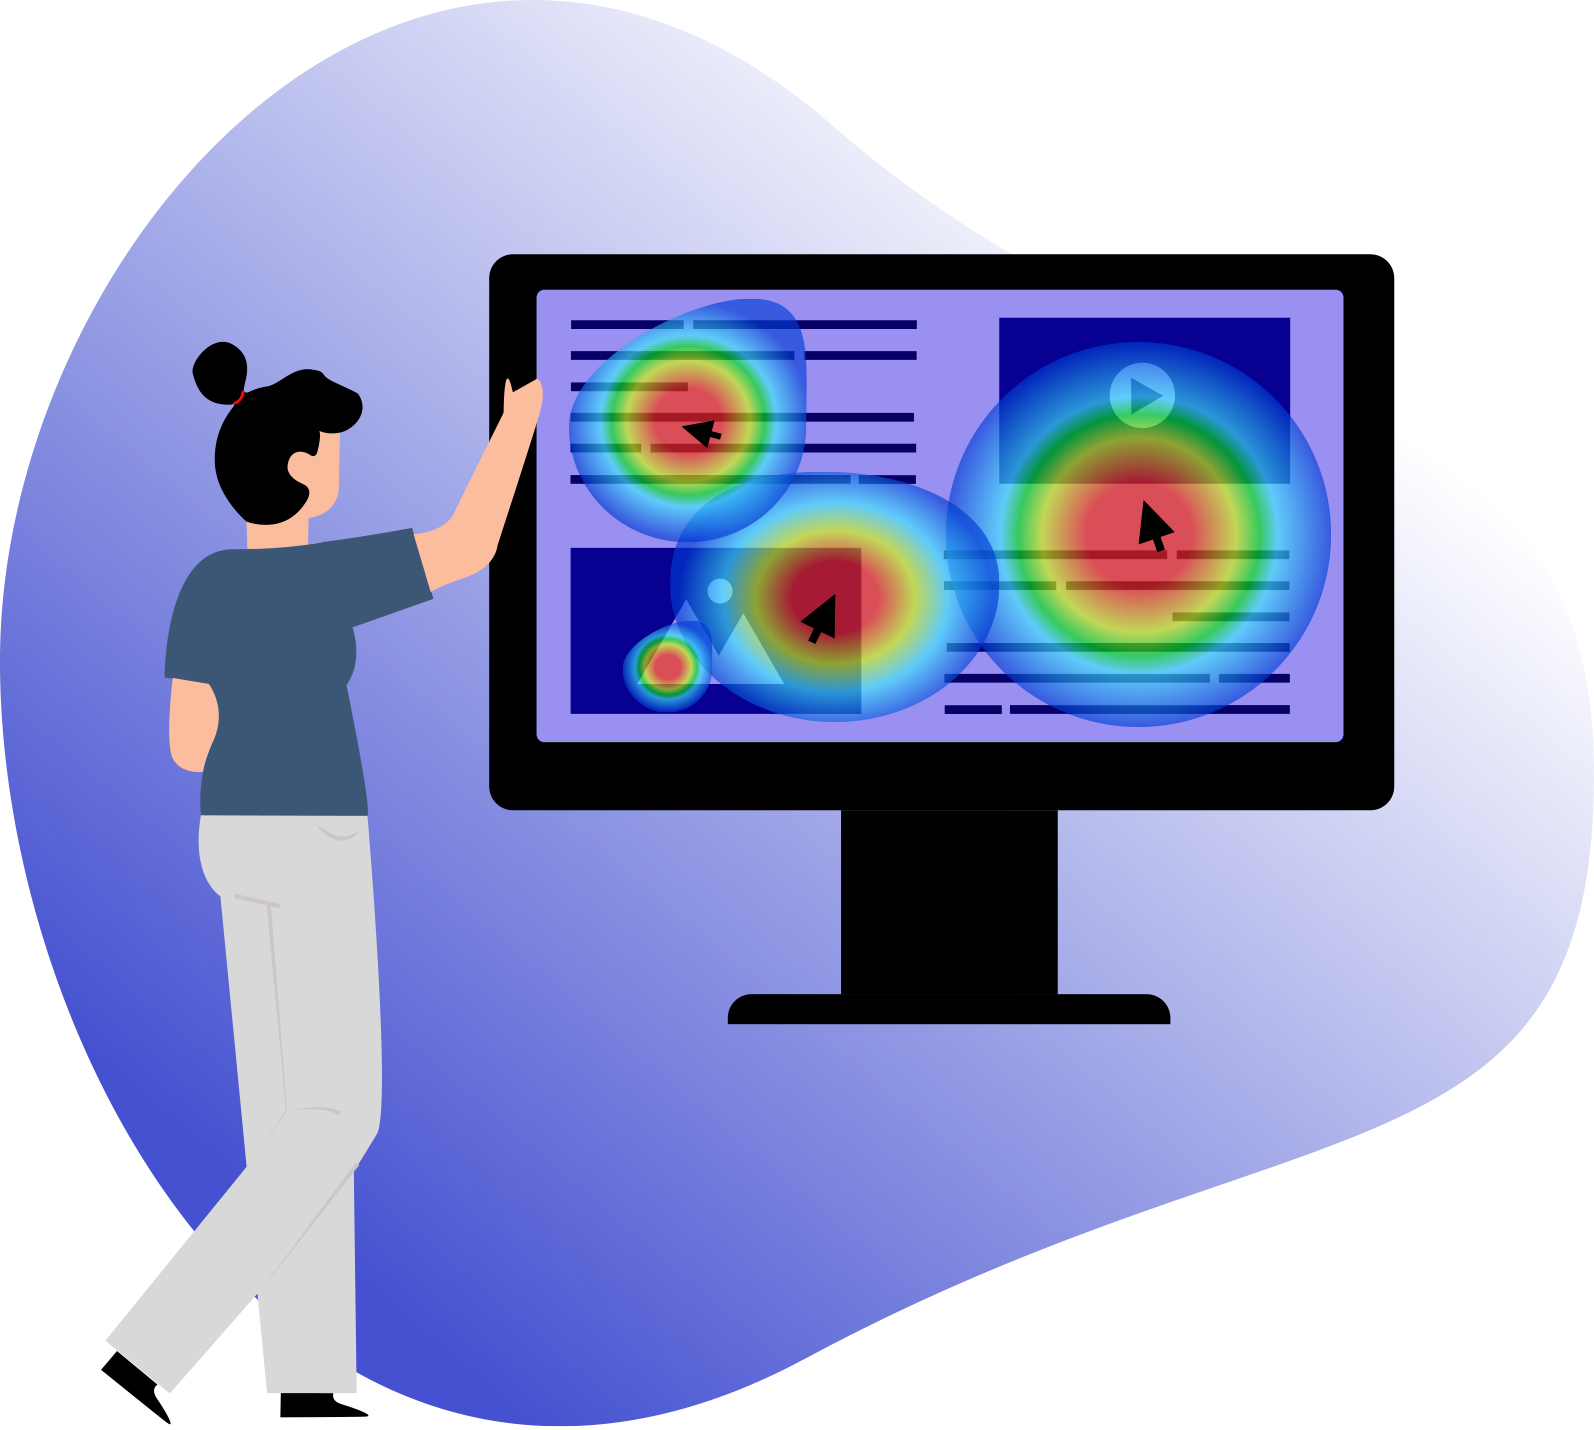
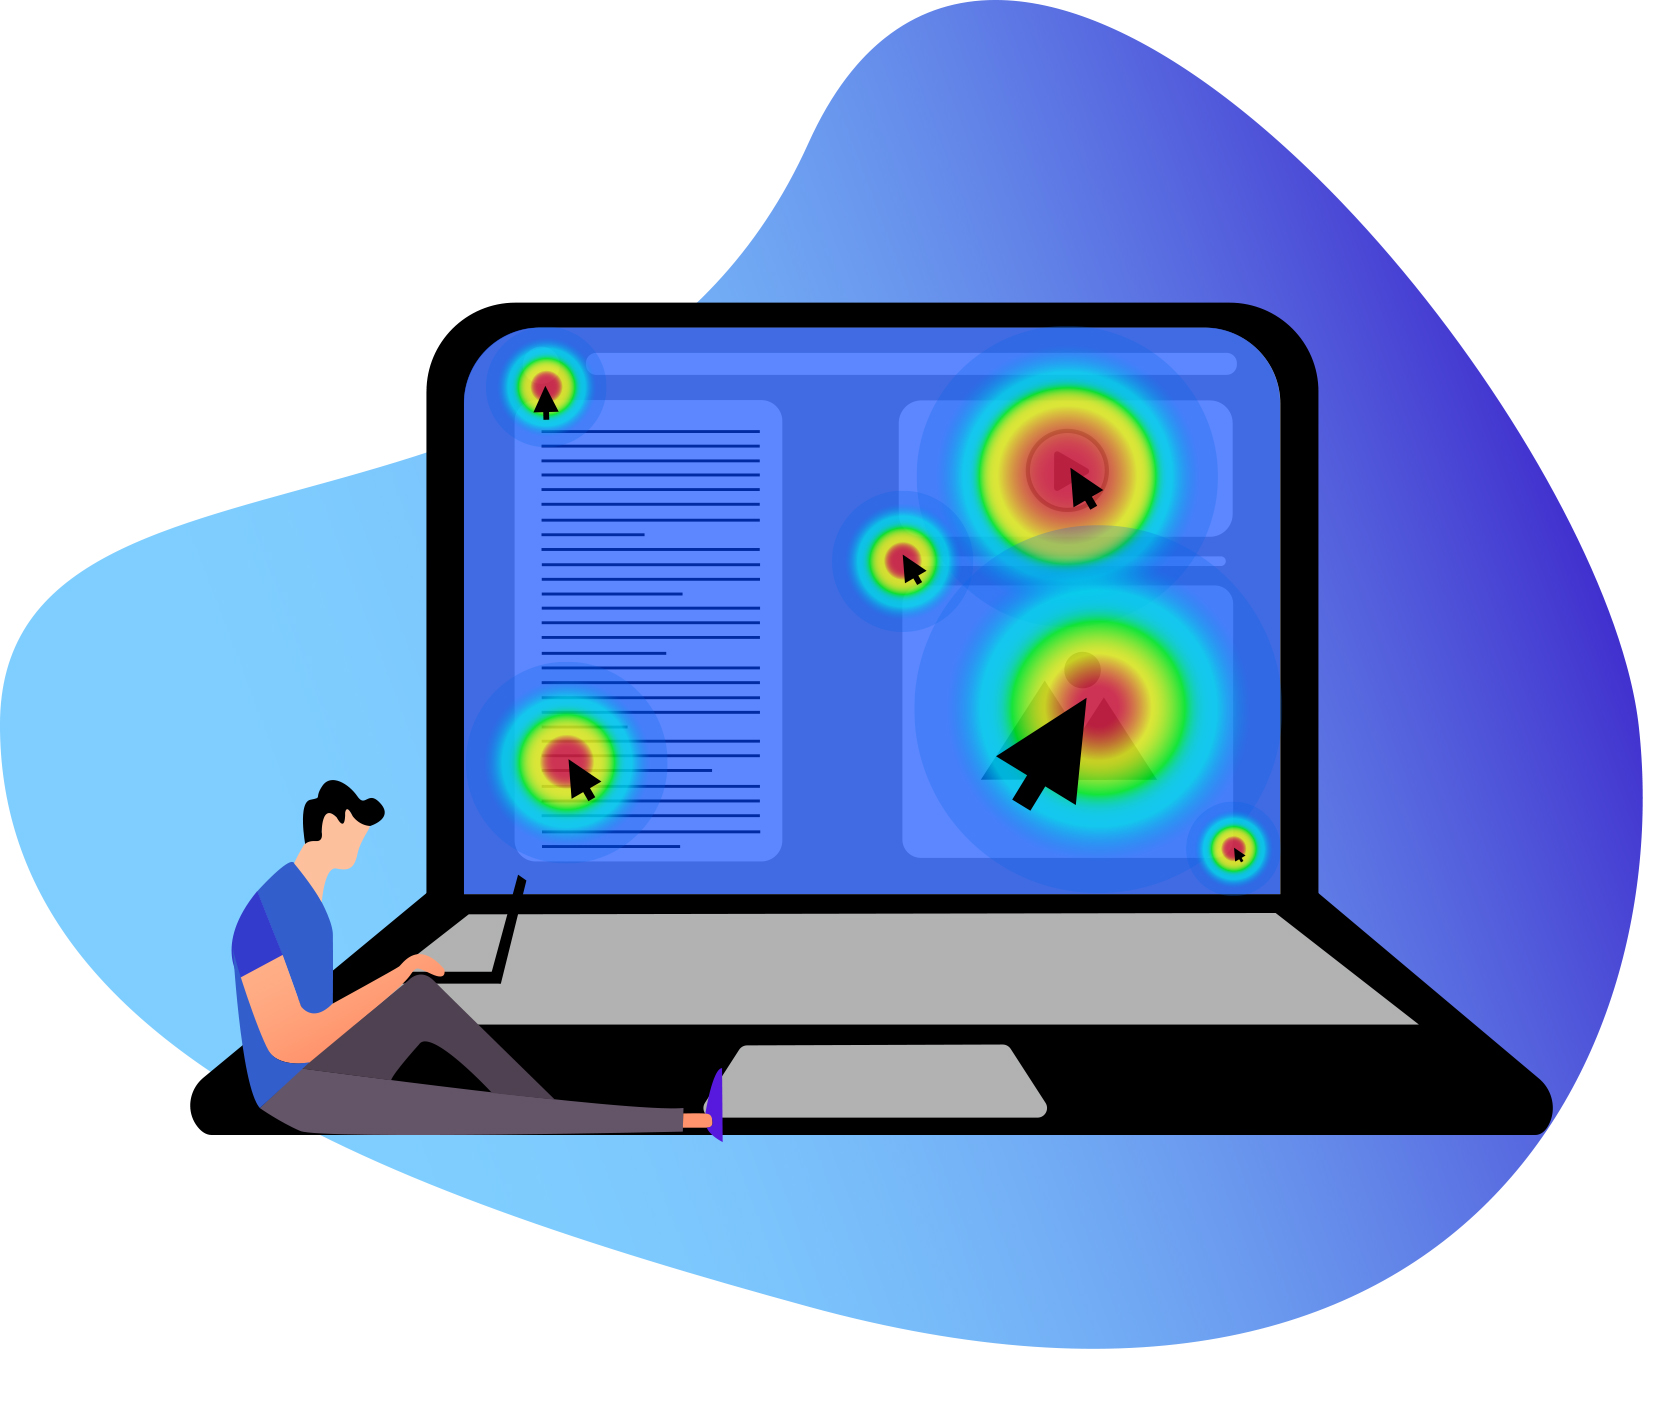
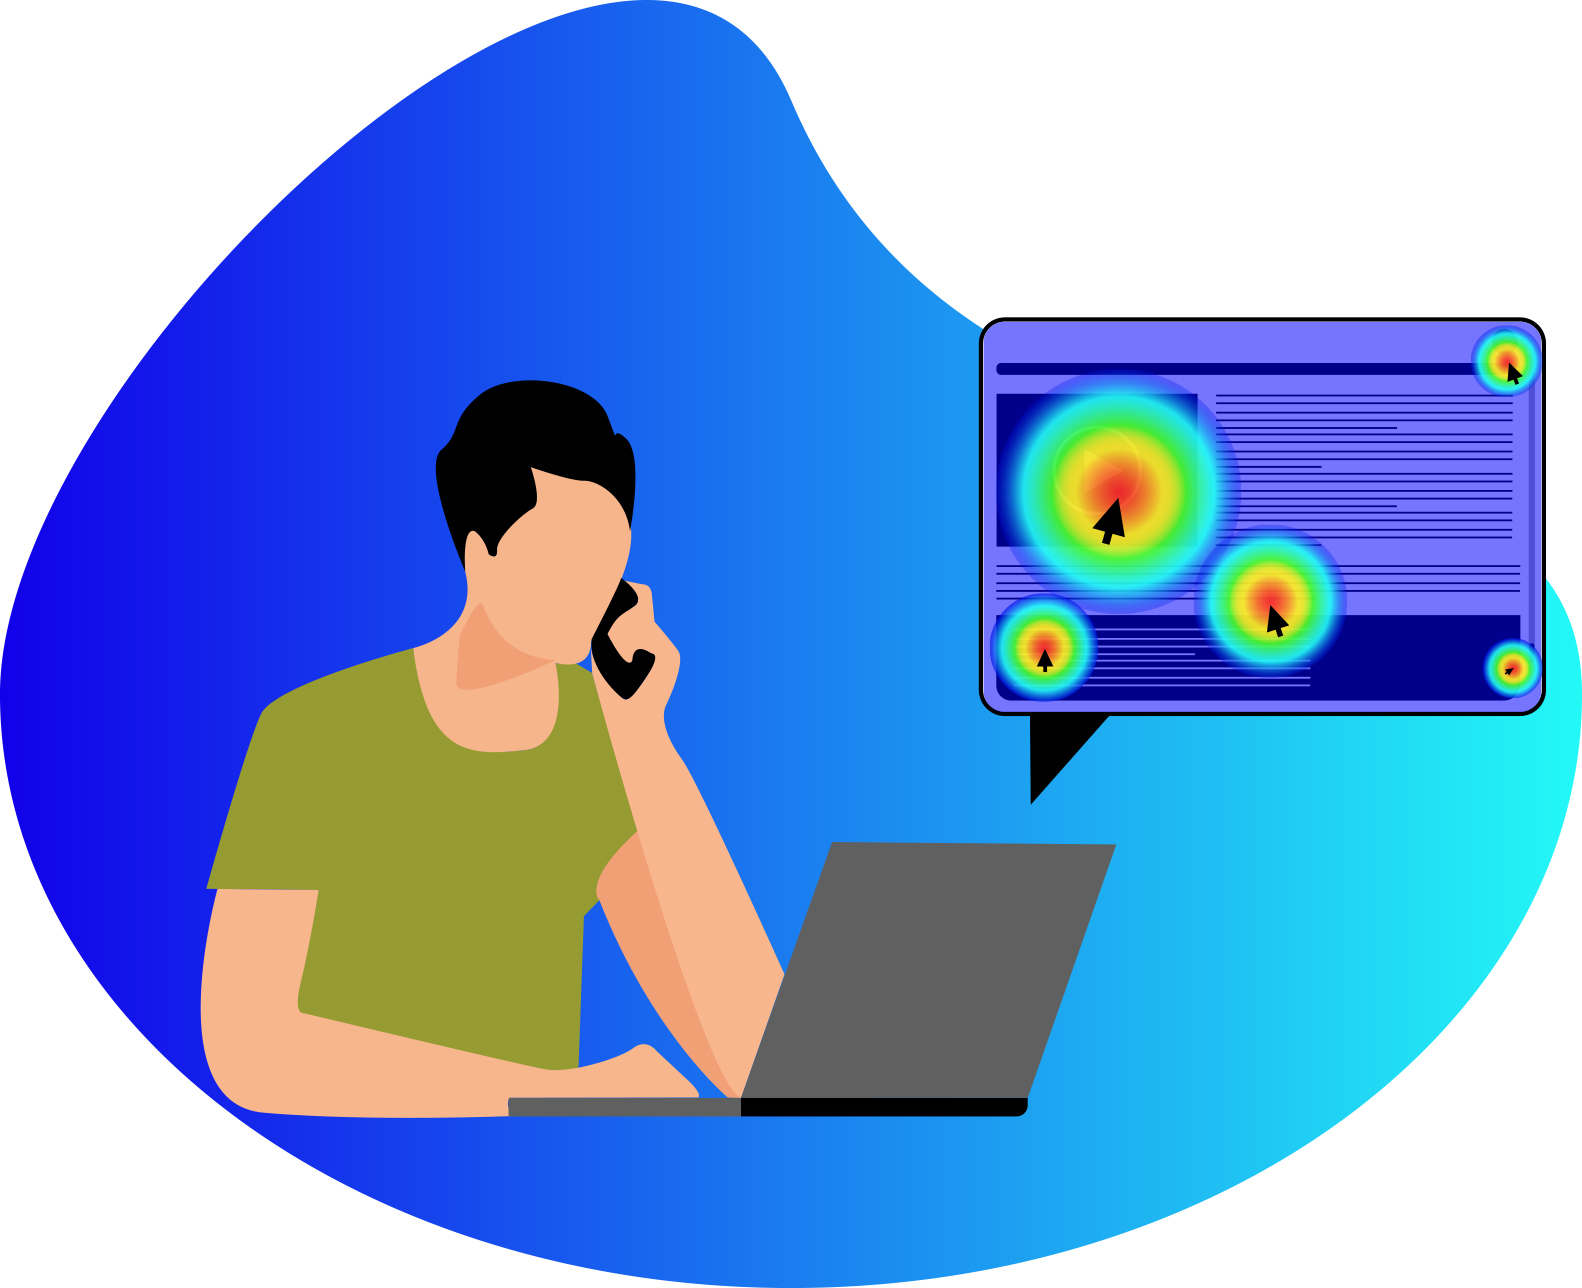
Website Heatmap

Despite the high site visits, sometimes you wonder why many users do not convert. What can you do to encourage the visitors to engage with the website?
In this article, you will learn how website heatmap tools can increase user engagement and website profits. In order to enhance the conversion rate, reduce bounce rate, and boost revenue, you should first, understand your visitors' behavior, and then try to modify web pages according to their actions and expectations.
Website Heatmap

How heatmaps tools can increase conversion rate and boost profits?

The Eyenaz heatmap tools give the opportunity to:

  • Monitor every user action (Clicks, taps, Scrolls, and Mouse movements)
  • Identify the most and the least popular sections on your web page
  • Find out the spots where visitors lose their attention
  • Check to see whether the users have engaged with crucial CTAs
  • Determine the best position to place CTAs
  • Learn which non-clickable components receive a lot of clicks
  • Improve the performance of the website according to users’ requirements

What is a website heatmap and how does it work?

A website heatmap is a graphic representation of how visitors generally interact with a page regarding their clicks, taps, scrolls, and mouse movements. They are perfect tools to show what users do on your web pages in detail. We might describe the website heat map as an analytical tool for websites that visually displays complex numerical information, such as the number of clicks on each element and the percentage of scrolling for each section.
The Website heatmap uses a warm-to-cold color scheme to show each section's popularity. Warmer colors (red, for instance) indicate higher visitor activity, whereas colder colors (blue) denote lower engagement. If there is no click on a section, the map shows that without any color.
The digital marketer and UX designer need to assess this color scheme. They must be knowledgeable about the heatmaps tools' capabilities and be aware of color variations.

3 Types of heatmaps tools

Website heatmaps provide three different tools that each concentrate on a specific action on a website. For a comprehensive analysis, use these three kinds of heatmap tools:

  • Click maps
  • Scroll maps
  • Mouse-movement maps

Click maps

Would you like to know if visitors are clicking on important website elements?
A click map is one type of website heatmap that indicates the number of clicks or taps on each element and visually illustrates the popularity of each section. With the aid of click maps, you may find CTAs that get ignored by users but are important to our goals. Also, you can identify non-clickable objects that get a lot of clicks or taps and distract visitors' attention. So, try to redesign the website for better performance.
Click map

Scroll maps

Do you want to know what percentage of users scroll all the way down to see most of the content you offer?
Scroll maps indicate how far most users scrolled down a page and which sections they spent the most time on. The Scroll map allows you to identify average folds (the section that every user sees after just landing on the page) and false bottoms (the area where visitors don’t scroll down because they think there is no more content there) on your page, so you can move important content to the proper position and give them more visibility.
Scroll map

Mouse movement maps

Move heatmaps also known as "hover maps" indicate where users are moving or hovering their cursor. By analyzing move maps, you understand which content people find most relevant or interesting on a page and where users focus their attention.
Mouse movement maps

3 Ways heatmaps tool can improve a website performance

1- Examine user interests on your website by heatmap for a future design

Typically, modifying a website design may cost you in some way. In some cases, you won't get optimal outcomes if you don't have enough knowledge of what you want to achieve. Before you modify the website design, pay attention to the heatmap tools. It is essential to redesign the website according to the users' interests and needs. Your visitors' interests are all revealed via website heatmap tools. First, look carefully at the heatmap tools, analyze them, and then plan for future design.

2- Evaluate user experience (UX) by using heatmap tools on new web pages

New and redesigned pages are highly significant. After creating a new web page, use different heatmap tools to evaluate the user experience and make sure your design is optimized. Instead of guessing how users will engage with the page, see what they really do. After a while, the website heatmap tools collect all users' actions and give the opportunity to redesign the page according to users' expectations.

3- Identify bugs and page design issues by website heatmap

Employ the website heatmap tools on pages with a high bounce rate to see the bugs and issues users are encountering. Sometimes a high bounce rate is the result of a tiny incorrect placement or a bug. The funnel can be used to identify the pages where users most frequently drop off the site. Then it is the heatmap tool's turn to find the bug on that page.