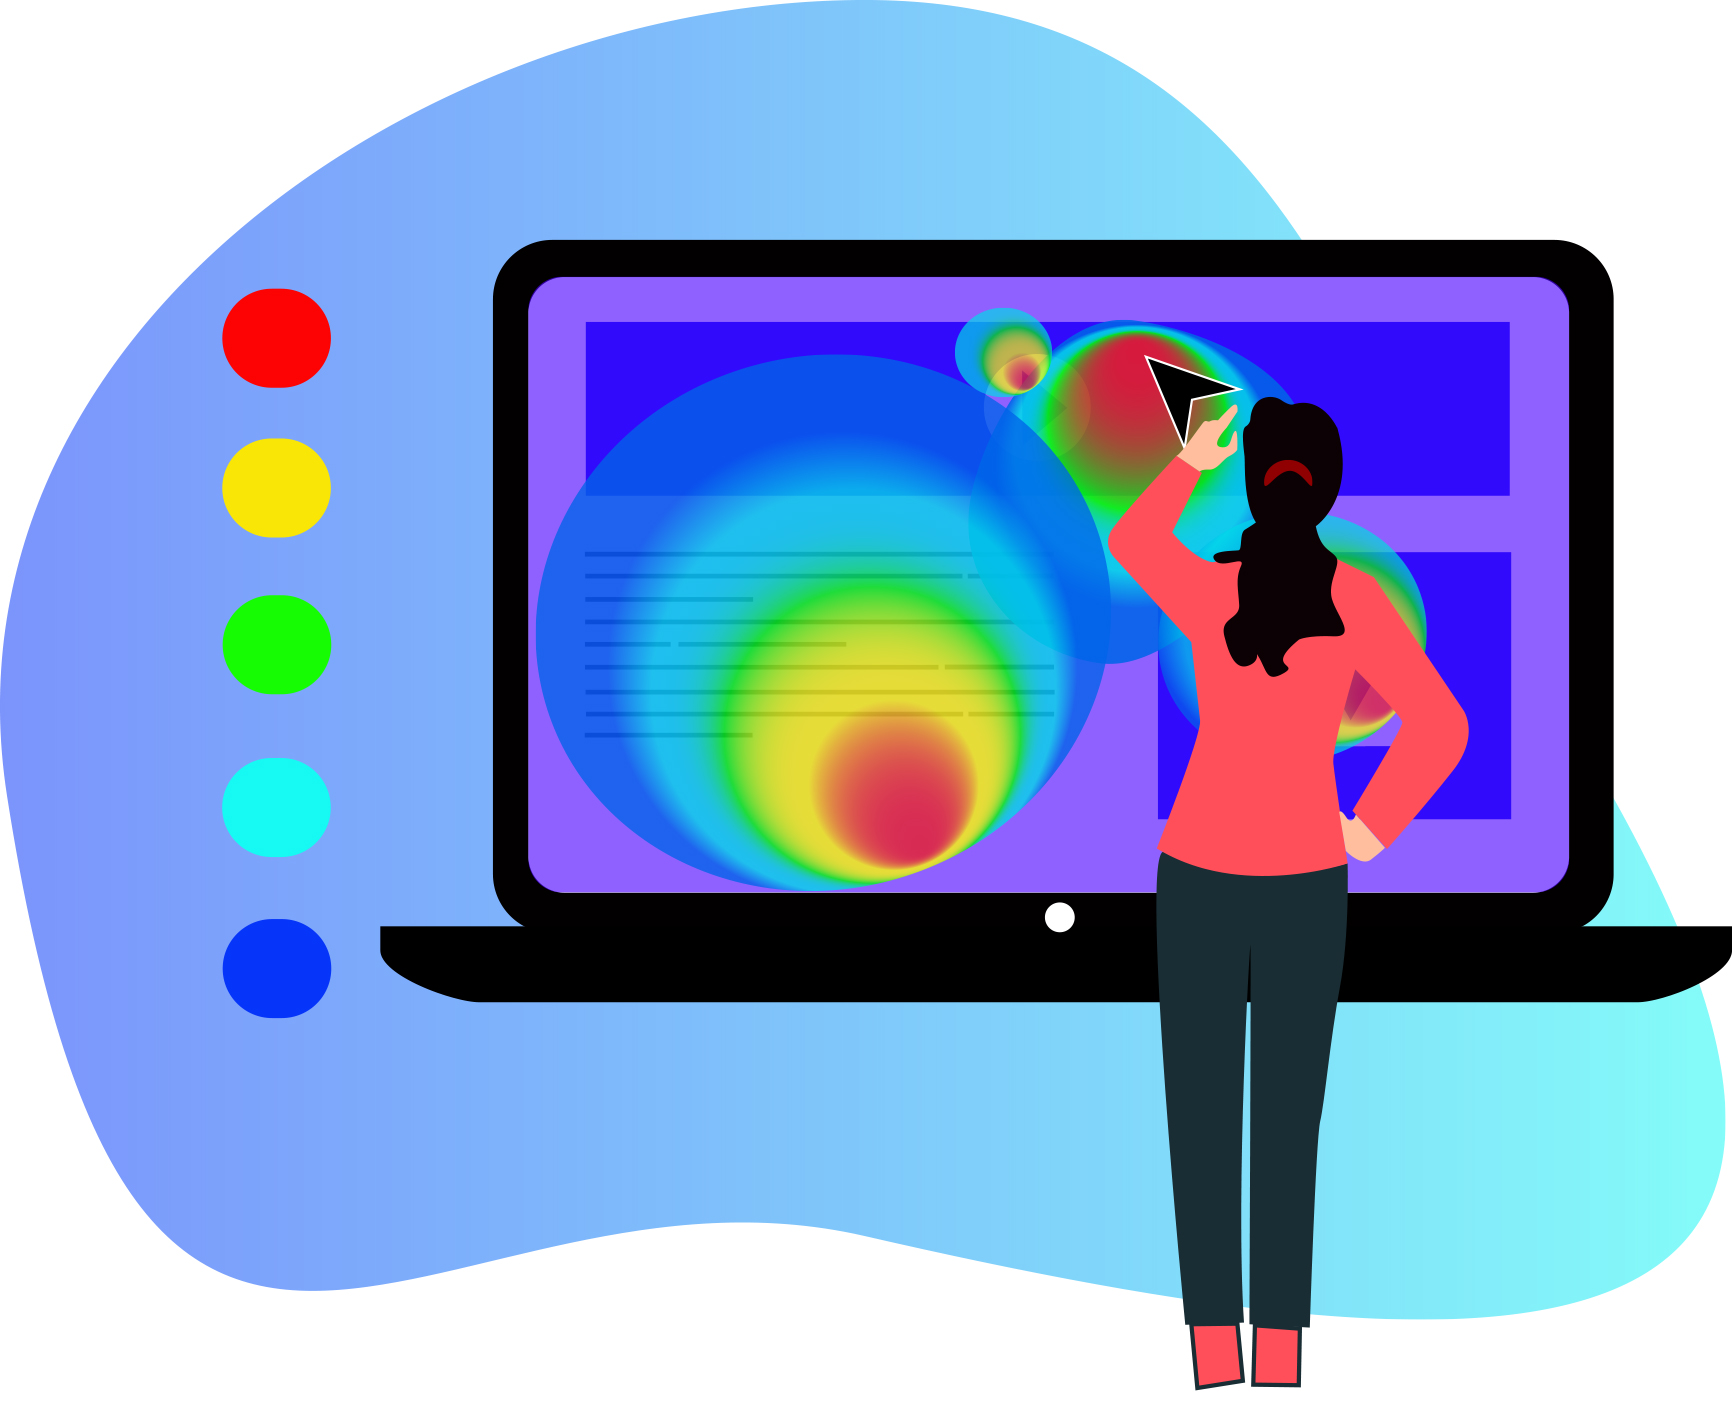
Click Maps

For an owner of a website or a digital marketer, nothing is more important than increasing the conversion rate. We'll demonstrate how using Click Heatmaps can boost conversion rates.
Eyenaz

How using click map tool can increase the website conversion rate by 50%

You need in-depth knowledge of your website and its visitor interactions to achieve remarkable success in converting. In addition to using statistical data derived from a quantitative analytic tool, you should use some qualitative user behavior tools like click maps.

The click heatmap tools allow you to:
  • Track every click and tap on a website.
  • Verify if users have responded to important CTAs
  • Discover the elements of your page that are the most and least popular
  • Find out non-clickable elements that get a lot of clicks

What is a click heatmap?

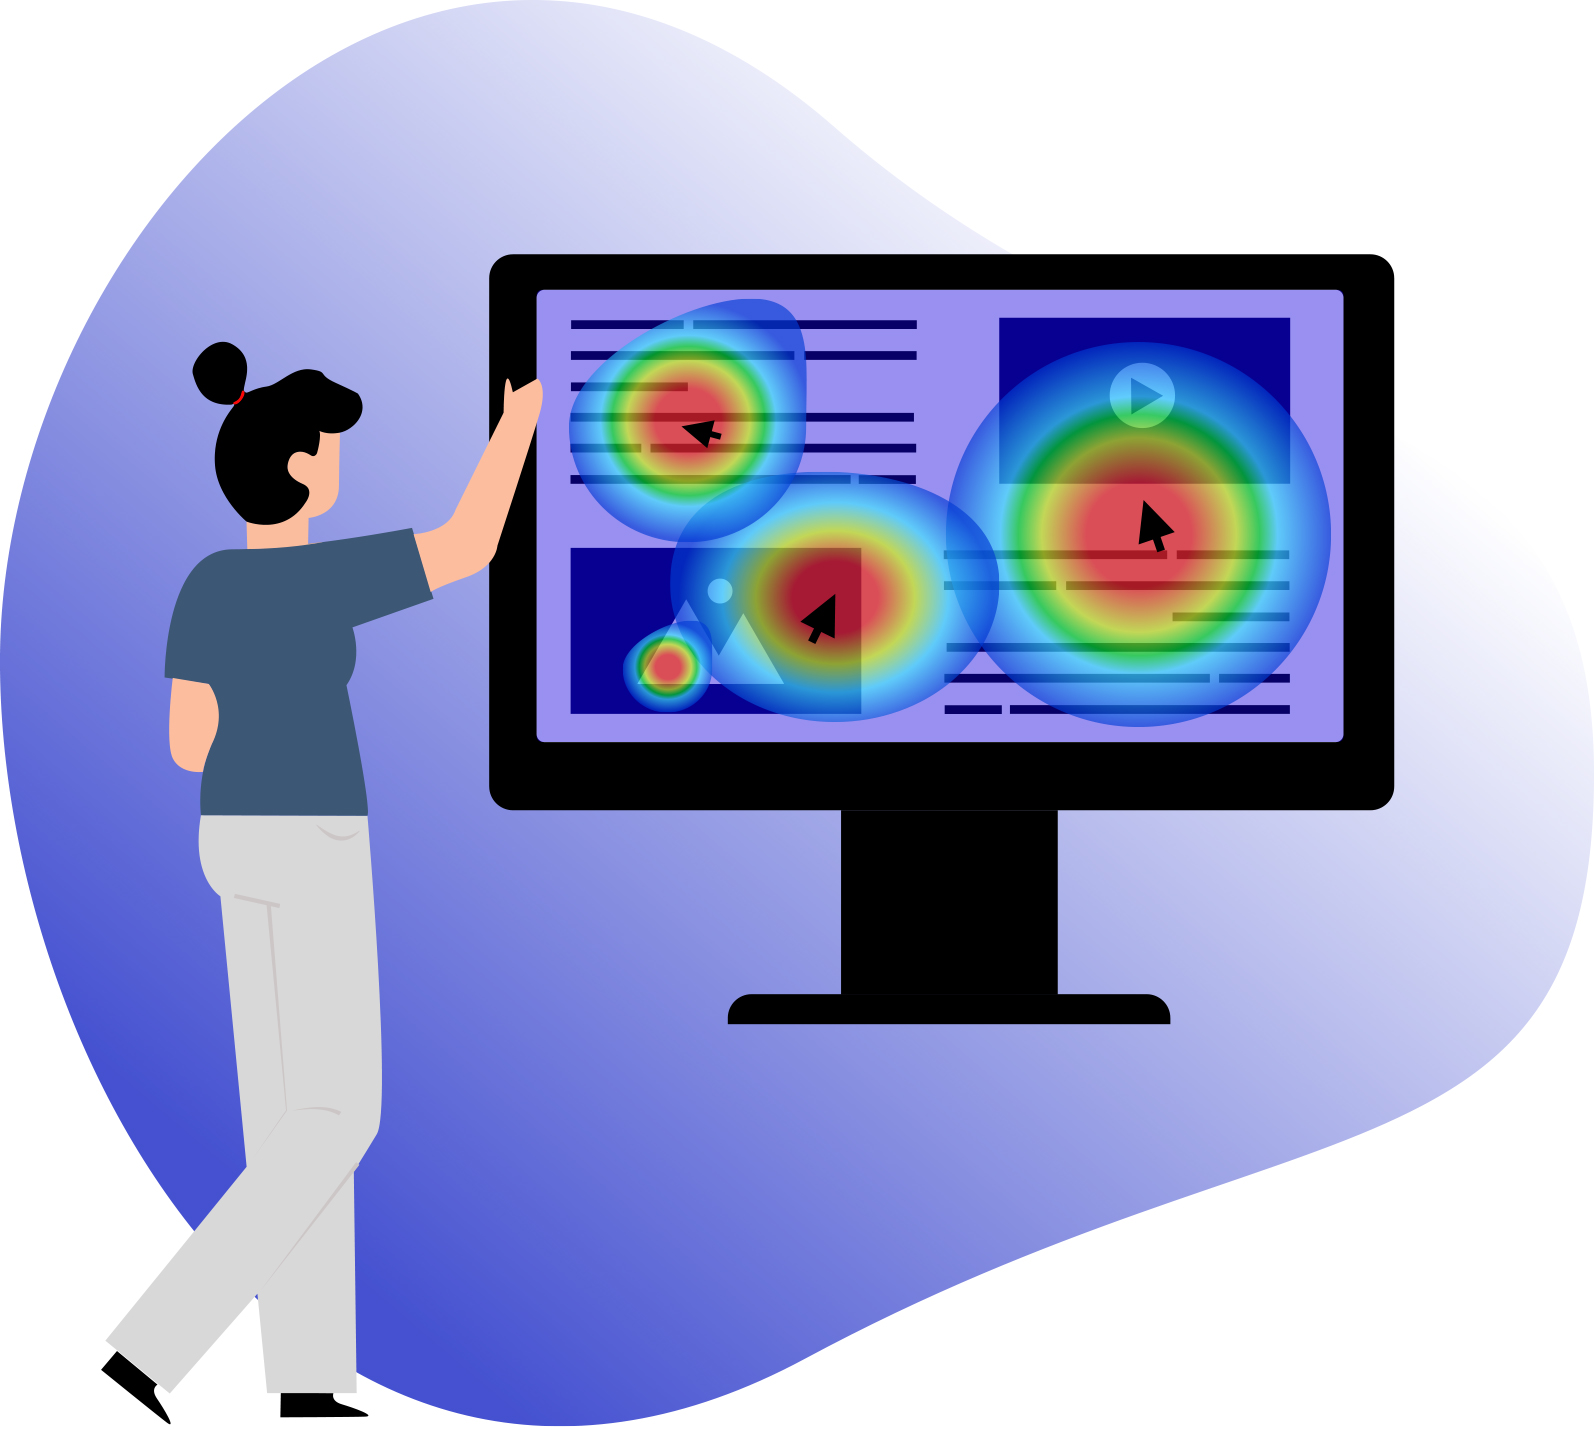
A click heatmap, also known as click map, is a type of website heatmap that indicates where users click on a desktop page or tap on a mobile screen.
Links, buttons, images, headlines, and even blank spaces are all clickable by users.
Also, you might have some critical CTAs on your pages that are expected to be clicked the most.
By looking at click heatmaps you can comprehend user behavior and see how they interact with your website. Do they reach the hot events, and which components capture their attention the most? Instead of guessing users' behavior or analyzing lots of numbers that come from Google Analytics tools, it is enough to glance at a colored click heatmap and see fascinating facts about your pages.

How does click heatmap work?

The click heatmap displays the aggregation of clicks using a colored map with warm and cool colors. It simply works by using hot colors like red on the parts of your page that receive the most clicks and colder colors like blue on those that do not get as many clicks as expected. Additionally, if you need more details on the number of clicks and user click percentage on each element, you can get those with the Eyenaz click heatmap. Our powerful click map tool offers a "Hot Event" feature that lists the most clicked elements on every page.

4 Elements you should keep track of in analyzing a click map

1.Images:
As a UX designer, you may put many pictures on your pages that make the website more attractive to users, and some may be clickable. A click map can show which picture gets the most attention and which one is being ignored the most. So, make those interesting pictures into valuable links.


2.Links:
Links that direct visitors to your goals can be the most important elements of a webpage. Use click heatmaps to identify where visitors expect certain links to place. For instance, on your home page, the links in the main navigation receive the most clicks. Whereas there are also areas that don't look attractive but get a lot of clicks. These happen because visitors are confused or expect something is clickable for more information, while actually, it isn't. This shows that your page's structure does not match your visitors' expectations, so it is time to change it.


3.CTA:
The call to action on practically every type of website can lead visitors to their intended goals, for example, sign up, log in, add to cart, purchase now, download, send Email, contact sales, and so on. It is time for visitors to make a decision, so you must place the critical CATs in the proper position to encourage them to follow your instructions. Use click maps tools to see if visitors are clicking on the primary CTAs or are getting distracted by other elements. Recognize all such distractions and place your CTAs on the best part of your web page.


4.Fields on forms:
Sometimes, during a form filling process, some unfamiliar items make the user drop off the page before completing it. You can see this friction in the click heatmap tool, where visitors get confused and frequently move their mouse around the specific fields and leave the page without clicking or reaching their goal.
Eyenaz

How combining click heatmap with segmentation can give a better insight

Suppose you are willing to get an in-depth analysis of a specific group of visitors. In that case, Eyenaz click map provides effective segmentation and powerful filtering to focus on your target audience.
For example, you might need to understand the behavior of a group of visitors from a particular region, who are the result of an ad campaign, or perhaps direct visitors. Try using click heatmap segmentation to get better results from user behavior analysis.

3 Click map examples and case studies

For click map case studies, read the following simple examples that have gotten amazing results.

1.) On a website with high traffic, there was a slide show with a (left-right) button that allowed users to view several product categories. After using the click map, it became apparent that relatively few people really used the left-right button to turn the slide show. Therefore, in a revision, the designer adjusted the slide show to auto-turn. The conversion rate increased by 5% as a result of this tiny modification.

2.) In another instance, there was an e-commerce website where visitors frequently clicked on product images, expecting to be redirected to a page with product information. But, because the picture didn't link to other pages, they were left in the dark. This action led to confusion and created friction. With the help of click heatmaps, we identified such patterns and made changes, and as a result, increased the conversion rate by more than 10%.

3.) Another example was an online tour website named Norotour included a long registration form with a high bounce rate. Many visitors had reached this page, but the drop-off was high. The click map indicated that the latest fields had been clicked less while they were mandatory. The designers decided to change the required fields to optional. The bounce rate was reduced by 20% by using a click map.

How to use click heatmap like an A/B test tool

Imagine we have two pages (About us, Contact us) including a CTA with different appearances and positions. For example, there is a "Send Email" button (Red and Blue on the top right and bottom left of each page). You are going to know which design attracts user attention the best. With the click heatmap tool, you can compare these two pages and find the best UX design. In this way, the click heatmap, like an A/B test tool, shows the optimal design according to users' interactions.

How to combine click heatmap with other user insight tools

For large eCommerce websites, using a combination of several user behavior analysis tools can have fantastic outcomes and help boost site revenues to a great extent. A click heatmap can be used in combination with other insight tools (Session Recording, Survey, A/B Testing) to gain a thorough understanding of users' requirements and interests.
With the Click map, you see the critical elements that have unexpectedly not been clicked. If you are going to modify them accurately, first try to find why these elements get ignored. You could use session recording tools on that particular page and watch real user interaction. You could also ask your visitors directly through the survey tool how they liked the page. Then create an A/B test according to those elements that have been ignored and choose the best UX design for your page.