Analyze A Website Heatmap

Analyze A Website Heatmap

How can you determine what your visitors really want?

As a marketer, you undoubtedly desire to be aware of your customer's needs and interests. To get insight into visitors' behavior and interests, you may deploy and analyze heatmaps on your website.
In this article, you will learn how crucial a website heatmap tool is for increasing conversion rates; what the most important factors are in analyzing a website heatmap; and how you can combine heatmaps with other user analytics tools to get high profits.

How does a website heatmap function?

When interpreting a website heatmap, pay attention to the various colors. By looking at the hot and cold colors of heatmaps, you can realize the popularity of different spots and user engagement, and as a result, you can find where crucial elements should be placed to be viewed more.

4 Important factors that you should notice in analyzing website heatmaps

1. Check to see whether the key elements are clicked enough
Even though all the elements on a page are noticeable, don't forget links, buttons, and CTAs. In addition to the graphical representation of user interaction, you can see the percentage of users' clicks on each element via the HOT Event feature. Look at the HOT Event table to see if your desired CTAs are at the top of the list; (the most clicked) otherwise, change their position or maybe the design.


2. Don't forget elements that get a lot of clicks but are non-clickable
Many of the objects on your pages are non-clickable but may get a lot of clicks. They include images, titles, shapes, and text that users expect to take them anywhere else. Identify these non-clickable elements by using click heatmap and modify the design to make them clearer.


3. Identify the average fold spot and false bottom
In analyzing a scroll heatmap, you should first, identify the average fold spot where users don't need to scroll down to browse content and then place the most valuable information (crucial CTAs) above the fold. Additionally, notice the area where visitors stop scrolling down (don’t view at all) because it seems there is no more content there (false bottom). Then remove the elements that make them confused, like blank spaces, line breaks, etc.


4. Identify the distracting elements of the page
If people are Irregularly clicking on various objects or moving their mouse anywhere, especially on unessential items, it means they are distracted by other components. You can understand that by looking at the move heatmap. You should remove unnecessary elements that distract users from the main path to achieving their goals.
4 Important factors that you should notice in analyzing website heatmaps

The best pages that are worth evaluating by heatmaps tools

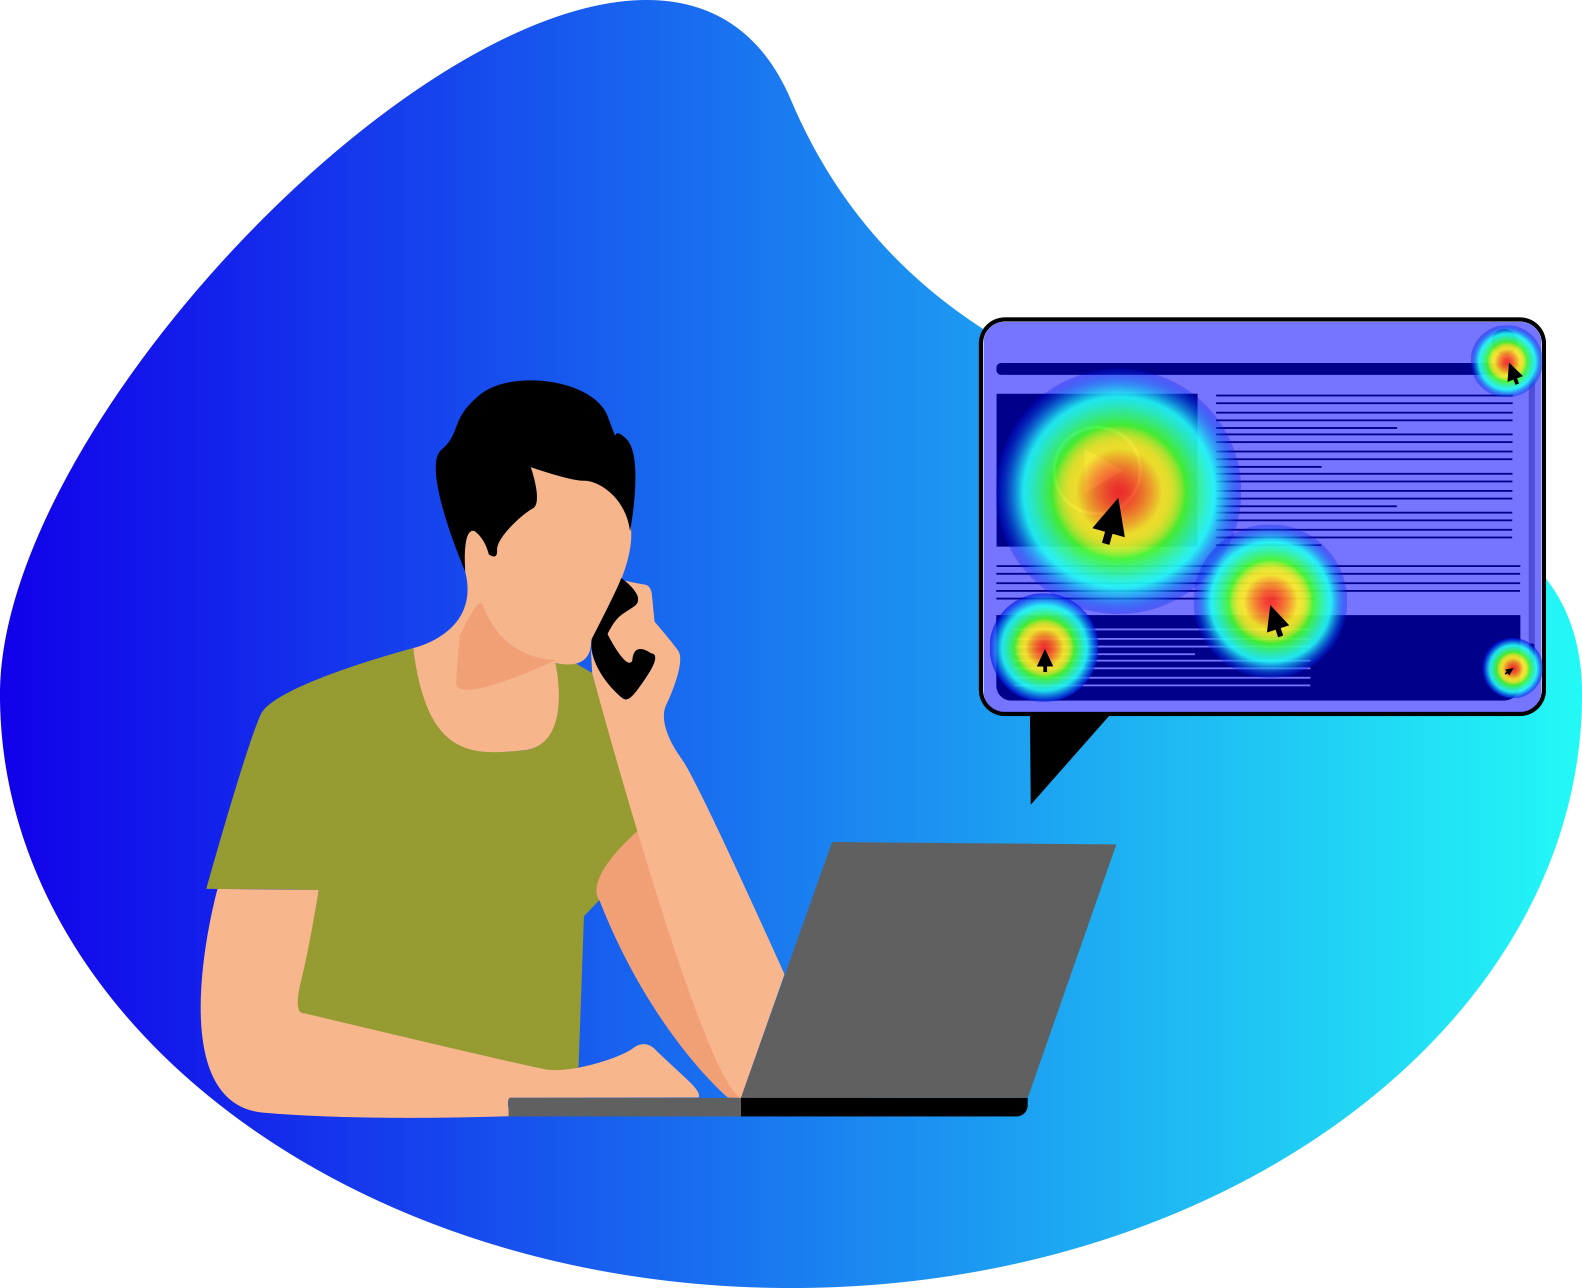
Heatmaps are necessary on all pages of your website, but if you set them up on some pages that are more important for your business, you will understand user behavior easily and improve your site's performance very soon.

1. Heatmaps on Homepage
The main page that makes a great impression on users is the home page. The home page functions like a showcase for your business. Usually, designers put an overview of all products, services, and the primary content on it. Furthermore, the critical CTAs like sign up, log in, subscribe, and contact us are typically placed on the homepage. Users interact with it and may decide to continue or leave the site. So, it is very essential to use heatmaps tools on the homepage to evaluate user experience, optimize the design and attract users' attention.

2. Heatmaps on landing pages
A landing page is a web page designed especially for a marketing or ad campaign. It's the page that a visitor "lands" on after clicking on an email link, or an advertisement from Google, YouTube, Facebook, or another social website. Generally speaking, landing pages are typically designed for a certain goal. You probably add specific content and CTAs on it that lead visitors to a particular path. After establishing the campaign, you should evaluate it to see whether it is effective for your marketing. Has your campaign received widespread participation? To evaluate the performance of the landing page, try using heatmaps tools.

3. Heatmaps on the most visited pages
The most viewed pages are crucial since their conversion rate or bounce rate could have a significant impact on your market. Forasmuch as many people visit the page, you should see how they interact with it. Do people scroll all the way down to view the entire page content? Do visitors pay attention to important CTAS? Use different types of heatmap tools to see how page design meets visitors’ expectations.
The best pages that are worth evaluating by heatmaps tools

4. Heatmaps on pages with a high conversion rate
If visitors interact well with a page and have a positive experience, we should be able to use its ability and excellence successfully on other pages. Therefore, use heatmap tools on pages with a high conversion rate to evaluate the page and discover why people like it and interact with it.

5. Heatmaps on pages with a high bounce rate
There could be some pages on your website that visitors don't engage with and leave the page before reaching their goal. Users may be experiencing a glitch or having an issue with one of the elements. With the aid of heatmaps, you can identify problems and discover why people aren't interacting.

6. Heatmaps on new pages
If your website has a lot of pages and you recently added a new page that has little data, you can use heatmaps to analyze its performance soon to optimize it as the user expects.

How do you utilize segmentation for better heatmap analysis?

We have the ability to find the mentioned pages with segmentation. To further examine, use segmentation and choose specific elements to filter the results and view the heatmaps of these pages.
You can filter data based on page:
  • Visited page
  • Landing page
  • Exited page

  • Based on traffic:
    • Direct traffic
    • Referral traffic
    • Social Traffic
    • Organic search
    • AdWords

    • And others:
      • Device
      • Browser
      • Rage clicks

      • Suppose you want to see the performance of a page with a high SEO rank that users find by searching on google. With the help of segmentation features, you can choose the Organic search item to see its heatmaps and determine whether the page satisfies the demands of visitors. If you desire to analyze a specific page (Home page for example) in terms of different devices such as desktops, mobiles, and tablets, as well as different browsers, segmentation features will allow you to quickly pick what you want. You can optimize UI/UX design and rearrange data by comparing heatmaps on different devices and browsers. If you select "Rage clicked," you'll see heatmaps showing where visitors clicked rapidly on your sites. It shows that there was a bug somewhere on your page, or there were non-clickable elements that got clicked a lot, and you should fix it. segmentation allows you to customize your filtration and choose multiple items at the same time. For instance, you might want to see heatmaps of users who came from a specific country and reached your website through direct traffic. This helps you filter various heatmaps and have better results.

How Combining heatmaps with other user analytics tools can boost conversion rate?

Website heatmap tools aren't complete on their own. If you want to gain a deeper understanding of user interests, and extra details about your website, you should combine heatmaps with other user analytics tools.
Our experience indicates that integrating heatmaps with other website analytics tools like website surveys, incoming feedback, session recording, and A/B testing can raise the conversion rate by 50%.


1. Combining heatmaps with survey and incoming feedback
Heatmap tools uncover user experience patterns, identify frictions, and tell developers there are some issues in their design. Feedback and website surveys assist the heatmap in understanding users' expectations and requirements. By analyzing heatmaps, you'll be able to make survey questions based on heatmaps results and find out why visitors don't convert. For example, If the scroll heatmap shows that just 40% of users are scrolling down to the bottom of a page, you should add a question on the website survey asking users which issues cause them to ignore the bottom of the page. In another instance, after analyzing a click map, you can directly ask visitors why they haven't interacted with a specific CTA.


2. Combining heatmaps with session recording
A website heatmap visually represents all clicks, scrolls, and mouse movement patterns of all users on a page. It is an accurate schema of user behavior. In addition to using a website heatmap for analyzing the users' interactions, you can watch the actual playback of the user session. By watching the actual session playback, you can see how users interacted with page elements and what made them leave the page. Consider the situation where the click map indicates there is an issue on an element. Now you should refer to the session recording to see what really happened on that page.
How Combining heatmaps with other user analytics tools can boost conversion rate?

3. Combining heatmaps with traditional web analytics tools
If you use web analytics like Google Analytics, you have a lot of numbers that don't tell you what users truly want from your site or why they quit it. By combining heatmaps with traditional analytics, you may look deeper into your pages and find answers to your questions about users in addition to having quantitative data.


4. Combining heatmaps with A/B testing
Heatmaps and A/B testing work with each other very closely. The marketer uses these two website analytics tools in two ways. After analyzing the heatmap, A/B testing is put into practice. It is the most commonly used way to combine the heatmap with A/B testing. If you have different pages and want to use A/B testing to evaluate their performance, you can run heatmaps to see which pages are better and compare them to find a way to provide good web pages.